
Gérer les conflits d’intérêts : de la théorie à la pratique
Apprenez à structurer et piloter la gestion des conflits d’intérêts.

🗓 Wednesday, December 3rd at 12:00 PM AEDT - Duration: 1 hour👉 Pour la version française, rendez-vous ici
👉 Watch the EMEA session here
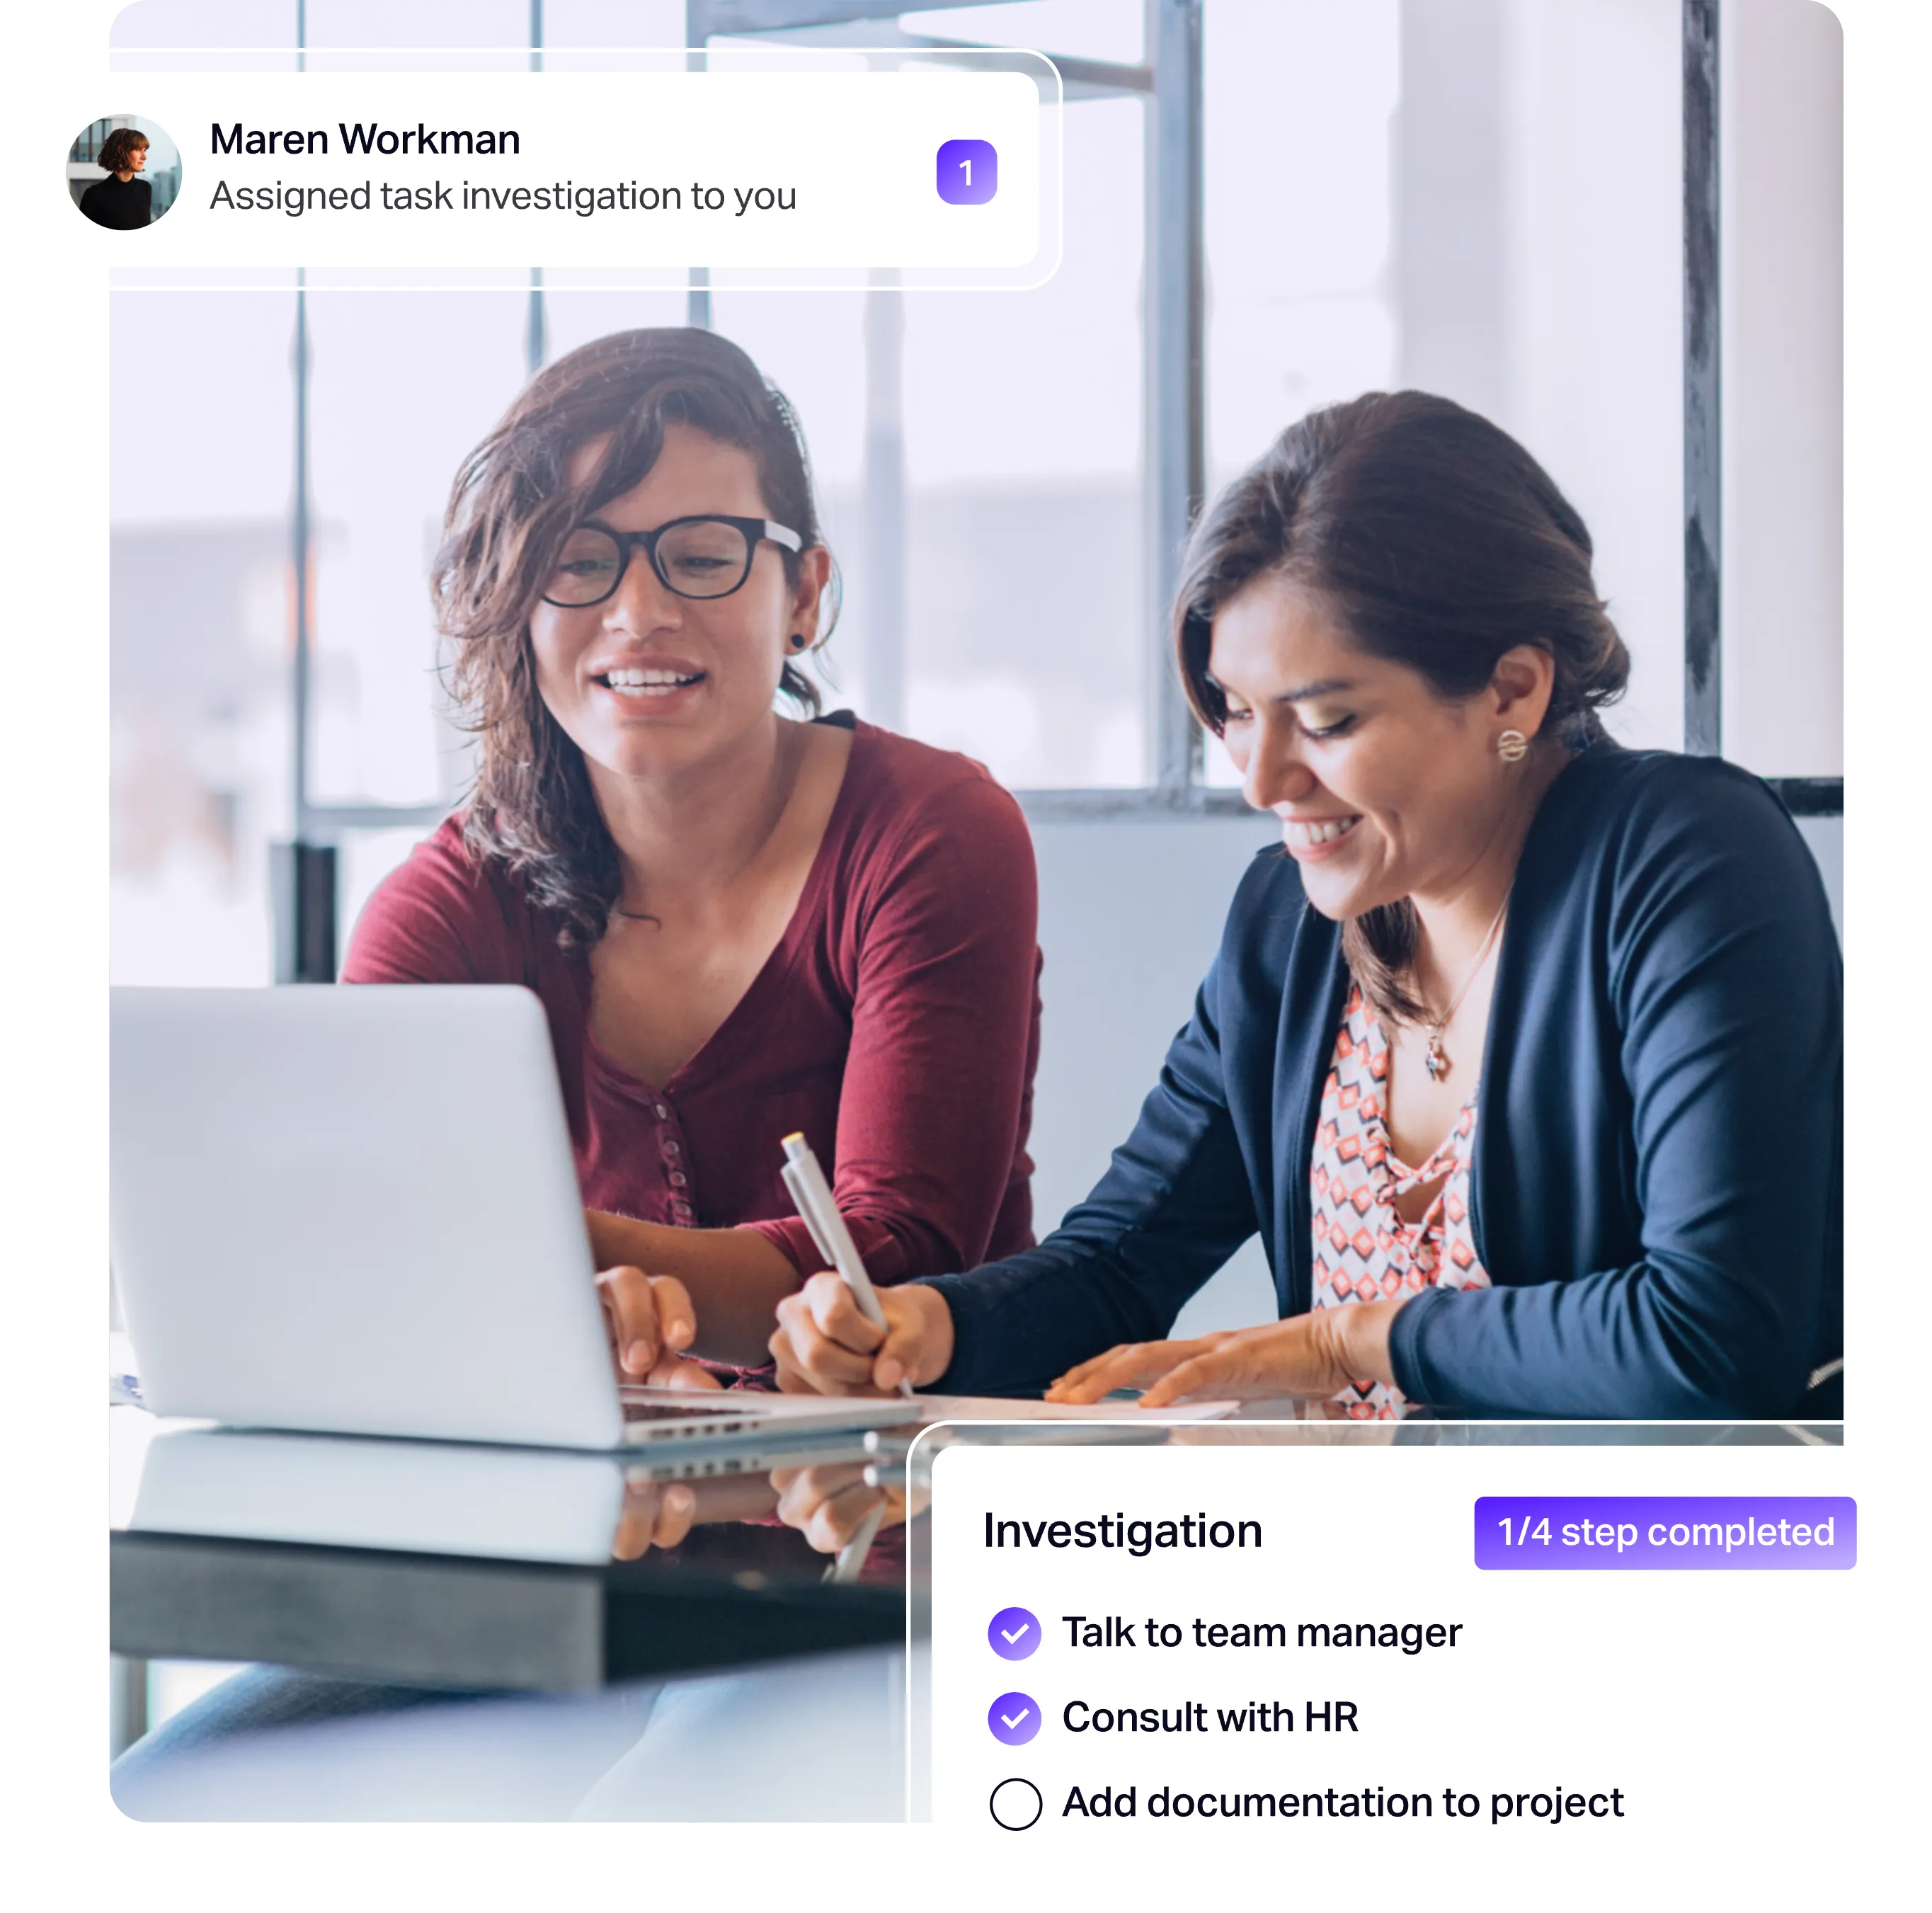
Over the past months, the Whispli team has reimagined the way reporting and case management data can be used, making oversight more visual, intuitive, and centralised.
Join this exclusive client webinar to explore the new dashboards of the leading whistleblowing platform, and see how you can track key indicators at a glance, simplify case management, and make reporting effortless. In this webinar, we will cover:
You’ll also have the opportunity to ask any questions and share your feedback.
Remplacez vos outils fragmentés par une plateforme de référence pour votre conformité.
Nos experts vous montrent comment Whispli simplifie la gestion de vos alertes, de vos déclarations et de votre gouvernance globale.
%201.avif)
%201%20(2).avif)
%201%20(1).avif)


.webp)